I love points made with GRAPHICS- how about you? Have you any other examples?. I am not talking about totally word memes.

 3
3


Enjoy being online again!
Welcome to the community of good people who base their values on evidence and appreciate civil discourse - the social network you will enjoy.Create your free account
5 comments
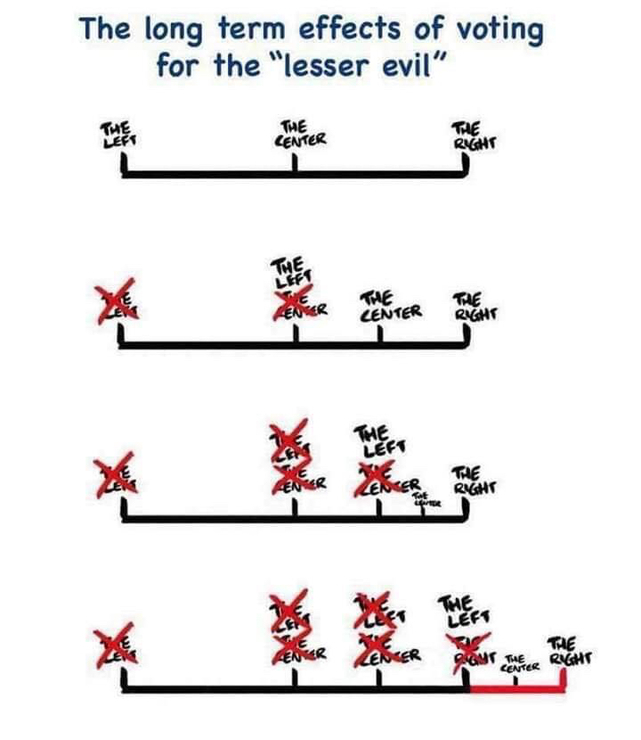
Feel free to reply to any comment by clicking the "Reply" button.I don’t understand the graphic. What is being voted for each iteration?
 indirect76
Level 7
Mar 13, 2019
indirect76
Level 7
Mar 13, 2019
0
Anything really. It is the TYPE of group that you vote for - not the individual issue
@Mcflewster I still don’t get it, but thanks for trying.
that's about it & during that time income/wealth inequality accelerated.
unfortunately the middle-class electorate have contributed to their own demise.
 callmedubious
Level 8
Mar 11, 2019
callmedubious
Level 8
Mar 11, 2019
0
Works both ways.
 BD66
Level 8
Mar 11, 2019
BD66
Level 8
Mar 11, 2019
 1
1
I am not quite sure what you mean by this post.

The Right has certainly lurched way to the right, Liberals are no longer considered to be centrist, but left wing, Socialists are conflated with Communists, and are beyond the pale completely. We are going to have to find completely new political terminology....the current ones are no longer fit for purpose. This graphic illustrates this perfectly.
 Marionville
Level 10
Mar 11, 2019
1
Marionville
Level 10
Mar 11, 2019
1
@Elganned True....take back the ground lost!
Enjoy being online again!
Welcome to the community of good people who base their values on evidence and appreciate civil discourse - the social network you will enjoy.Create your free account
Share this post
Categories
Agnostic does not evaluate or guarantee the accuracy of any content. Read full disclaimer.